There is some pre-requisite knowledge to get anything out of this post, so feel free to skip ahead.
Core Web Vitals are a set of site speed / page experience metrics.
Sites which ‘pass’ Core Web Vitals (and lack intrusive popups, are served via HTTPS, and pass Google’s mobile friendliness assessment) are said to have good page experience, and receive an indeterminate positive weighting in Google Search results.
This indeterminate and perhaps fictional uplift is appealing to SEOs.
Experienced consultants are rightly a little sceptical about the impact:
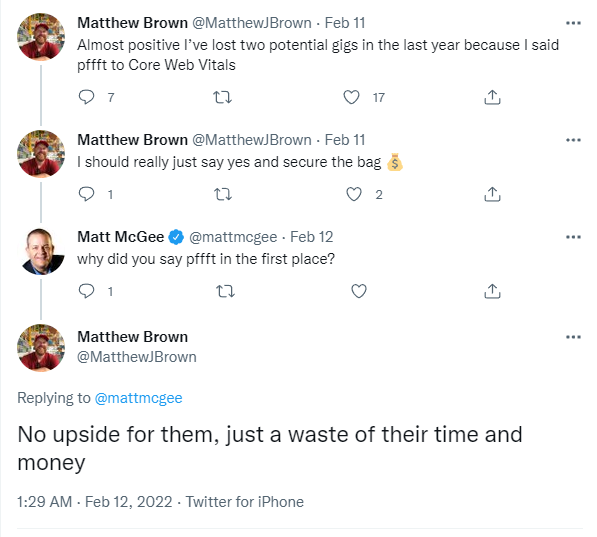
Page Experience feels to be a repeat of the HTTPS-as-ranking-signal rollout; irrelevant at the time, but eventually important (I think Tom Capper said this).
Consulting for businesses which are mature regarding SEO is sometimes about eliminating doubt in order to free up headspace for the team.
My understanding is that for Good Page Experience ranking consideration, you’ll either pass the Core Web Vitals assessment or you won’t.
By ensuring a site passes Core Web Vitals, the SEO team of the business can no longer point to it as a potential explanation for poor organic performance. This is valuable certainty for the SEO team and the business as a whole.
Usually, working on this will not be the best use of the team’s time, but neither is it likely to be completely wasted. Faster and more stable pages are generally better for a business than glacial (yet erratic!) ones. If you are reading this, you probably understand.
I will not trot out one of the studies.
The Core Web Vital I’m concerned with today is Cumulative Layout Shift.
The simplest way to think about this is “do parts of the page move when the user is not expecting them to? Why is it doing this? Please make it stop.”
I wrote the majority of this post 3-4 months ago, and had discarded it as an abject failure. I wanted to hold off on publishing until I got beyond "weird, huh?" stage.

I thought I'd solved it when I first wrote it, and while I sort of had, I'd overlooked something important.

I'm sharing it now.

Like I said above, it's better to stop thinking about things.
The Problem
I’d described this work to a friend as “a client has successfully baited me with an interesting problem, and now my brain has it running in the background and I don’t want to think about it any more so I have to solve it.“
I’d recently completed a project for a client, and in the interests of forgetting about Core Web Vitals (as far as SEO goes), we did some work to ensure the domain passed.
This took a little diagnosing, but essentially slower connections on one template of the site were resulting in layout shifts because of how fonts were loading.
Credit to Simon Hearne for making the fix we needed very easy to understand https://simonhearne.com/2021/layout-shifts-webfonts/
We got fonts loading correctly in ways that didn’t result in layout shifts, regardless of network conditions or heading lengths.
The client turned this around very quickly, and suddenly every synthetic test we made was showing 0 CLS.
We just had to wait the 28 days for it to be reflected everywhere.
…
It’s now the distant future.
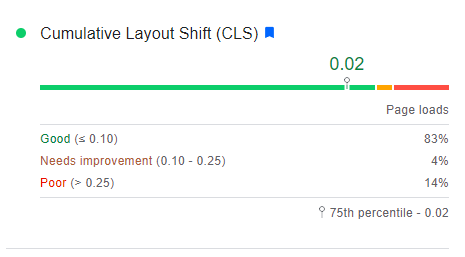
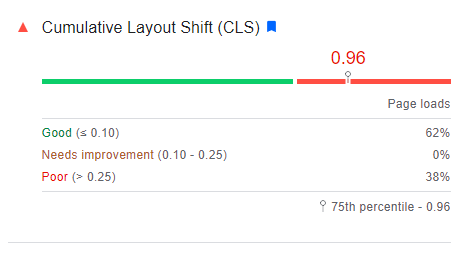
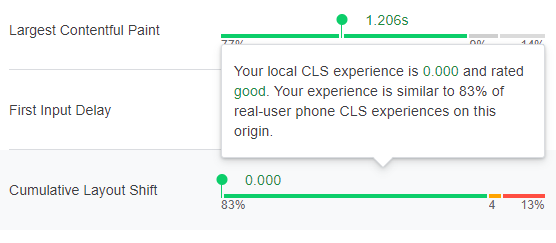
PageSpeed Insights was showing this for the Origin:
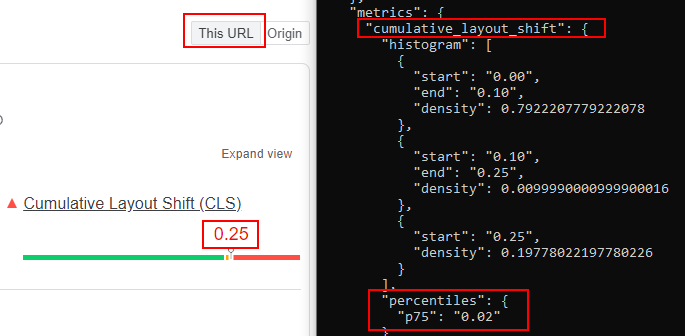
This is much improved, but 18% of page loads were still experiencing unacceptable layout shifts, even if P75 was 0.02.

(I’m reading this as “a randomly chosen URL is likely to be bad, but the high traffic URLs are generally very good, so a randomly chosen session will likely be good.”)
From Google Search Console we could see that the failures were clustered around the same template we’d just fixed.
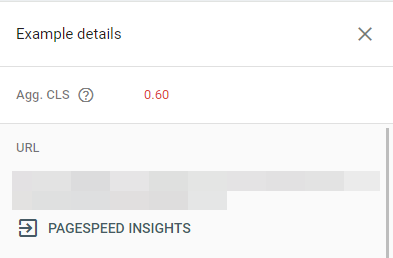
For failing URLs which actually had data, it looked like this:
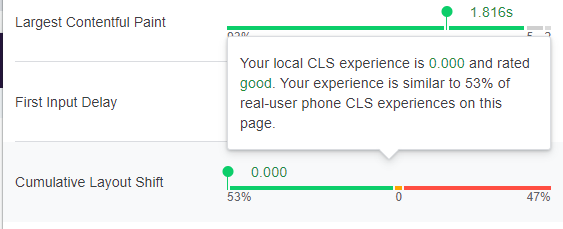
Frustratingly, every single synthetic test we tried on the sample URLs returned zero CLS, including:
- Requests from other countries using a VPN.
- Requests with and without cookies.
- Requests with simulated slow 3g connections and CPU slowdowns.
- Requests with JavaScript disabled or enabled.
- Requests where we were combining the above.
- Requests from actual devices (e.g. using my actual phone etc).
Quick Detour:
You can easily send the current page you are looking at to another Android device using this feature:
Country Restriction
I got stuck on the suspicion that there was some GEOIP popup triggering in some territories on this template only, but I just had to find the correct country and then all my problems would be solved.
This wasn’t to be.
Now, it’s possible to get country level CLS data for origins (domains) from the Chrome User Experience report BigQuery project:
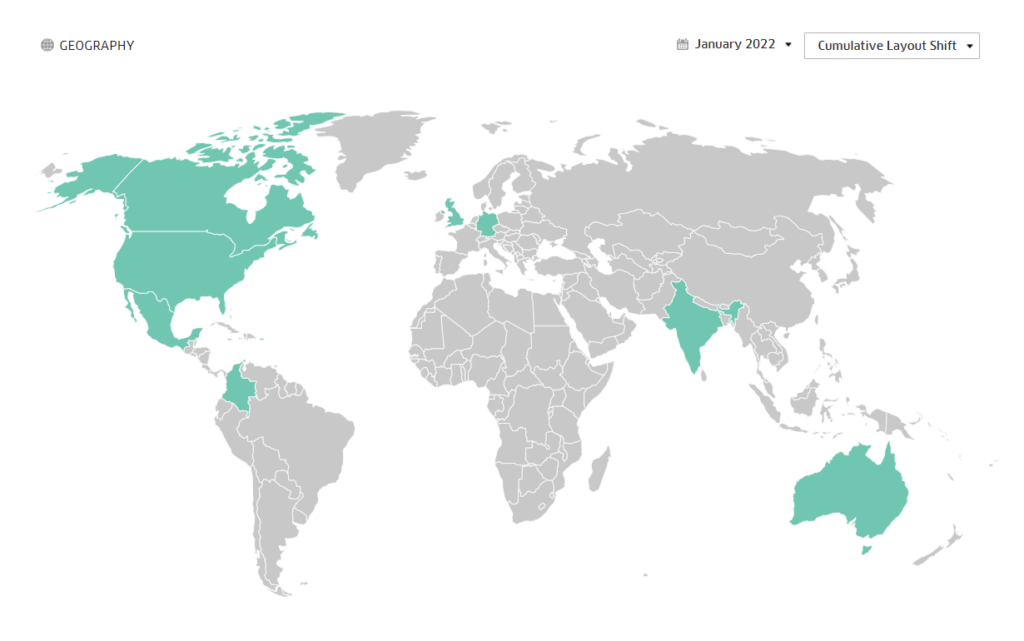
But this wasn’t telling me anything; the Origin passes CLS in every country (with enough user data, and the ones without didn’t have meaningful traffic).
But the layout shift issue was only affecting a single template, so is something we can only attempt to assess by the URL level, since the site average is so good.
So while I tried a few methods, all I’ve discovered is that you can’t currently get URL level data filtered by country from the API. It’s planned – https://web.dev/chrome-ux-report-api/#what’s-next (last updated Jun 25, 2020).
Oh well.
Approach
I ignored this a bit longer and ran it past some other SEOs to put some pressure on my brain (“you’re not going to let someone else solve it, are you?”).
I sat down with a fresh coffee and re-examined PageSpeed Insights was actually telling me about the problematic URLs:
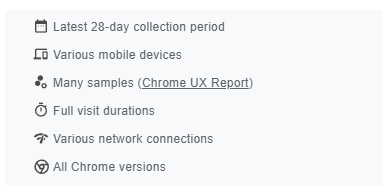
The URL and Origin Level Data shows:
- Latest 28-day collection period
- Various mobile devices
- Many samples (Chrome UX Report)
- Full visit durations
- Various network connections
- All Chrome versions
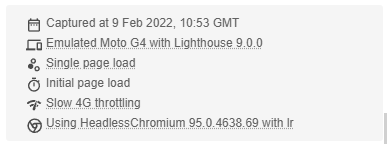
The Synthetic Test returns the following:
- Captured at {date}
- Emulated Moto G4 with Lighthouse 9.0.0
- Single page load
- Initial page load
- Slow 4G throttling
- Using HeadlessChromium {version} with lr
Have you worked it out yet? It's right there.
As always, this seems completely obvious in hindsight especially when you review them side-by-side. To be crystal clear, the reason I wasn’t solving this was because:
It’s Full Visit durations.
Oh.
I don’t think this is completely obvious in the documentation, but also, this is a rare situation.
So I started to think in terms of potential user journeys rather than individual page loads. Common journeys in your Analytics may help, but essentially you visit the pages suffering from ‘layout shifts’ and replicate some likely user behaviours.
I found Addy Osmani‘s Web Vitals extension the most useful for detecting which journeys within the site were potentially triggering CLS, however, I also had great success with The Recorder which recently appeared in Chrome as experimental:
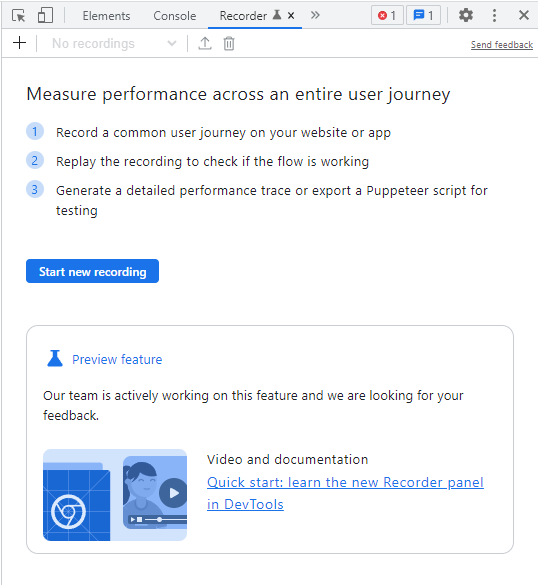
I won’t really do it justice, but it’s a bit like a performance focused Puppeteer (without needing to install anything); you can record and playback interactions and combine these with Chrome’s performance tools.
I’m sure it could be used for slightly nefarious purposes.
As for the ‘problem’, it was caused by internal /#anchor links. Think of a forum with links to individual posts, and a helper function to shift these to the top. There’s a flash of the actual first post before the #post is shifted into view.
So:
- If you visited
/example-pageyou would get 0 CLS. - If you visited
/other-example-page, you would get 0 CLS. - If you visited
/example-page, and clicked on a hyperlink link to/other-example-page#anchor, you would get a big layout shift. - f you visited
/other-example-page, and clicked on a hyperlink link to/example-page#anchor, you would also get a big layout shift.
These were common enough journeys, so were enough to skew the mobile assessment of the site as a whole. The client then confirmed they could replicate this and immediately applied a fix (removing these links).
I believe these were getting classified as page load behaviour and unexpected layout shifts, rather than expected layout shifts from an interaction (because the interaction happened on the previous page).
Hash URLs
Though kicking myself, I didn’t spot this earlier because I wasn’t ever querying the /#hash URLs. These never showed up in Search Console or any other tooling.
But if I did, I have no idea if /#hash URLs are actually stored by CRUX, or surfaced anywhere else.
E.g. If you query the Crux API with a url/#fragment then it gets normalized:
  "urlNormalizationDetails": {
    "originalUrl": "https://web.dev/cls/#what-is-cls",
    "normalizedUrl": "https://web.dev/cls/"}
I’ve tried this on high traffic URLs I could dig up from across the internet, but each got normalized. Let me know if you get one working.
If you want to attempt to understand this, you can look here, or there. I am too weary.
"Object representing the normalization actions taken to normalize a url to achieve a higher chance of successful lookup. These are simple automated changes that are taken when looking up the provided url_patten would be known to fail. Complex actions like following redirects are not handled."Helpfully we removed these internal links before I realised this was a thing and could investigate this further.
Initial Results
The way the 28 day average data works, our numbers initially got worse in Search Console, PageSpeed Insights, and via the CRUX API. Throughout this work, and since the fix, PageSpeed Insights, Search Console, and the CRUX API have all given different numbers:
There is no doubt a reason for this, but I am ignorant of it. Things started looking better pretty quickly:
The delay to see results is unfortunate, because you don’t know whether you’ve solved the issue, or simply fixed one cause among many.
I was ignorant here – I didn’t know that this existed at the time – https://github.com/GoogleChrome/web-vitals (allows you to get RUM into Analytics or GTM etc, rather than waiting for updates).
The Interesting Part of This Post
But it didn’t really work. It seemed to fix some, but not all or the URLs in this template.
We’d only partly solved the issue by removing the internal links to # URLs.
It was only months later after some distance I discovered that there was an external user-facing source of these # URLs.
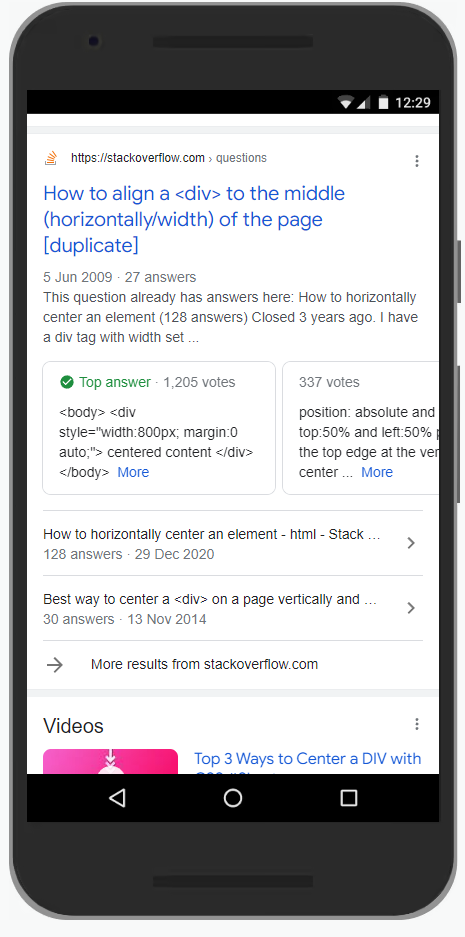
Google search.
Google wasn’t ranking the # URLs, but it was linking to them from richer SERP features. For us this was via Q&A structured data, which for this site were far more prevalent on mobile, rather than desktop:
URL is a Recommended property of Q&A rich results, but in practice a required one if you want the better SERP features:
It is strongly recommended to provide a URL for each answer because it improves the user experience when the user clicks through to your site.
I don’t think I’d recommend removing them here, but we did need to change the “helper” function to act as a more traditional page anchor.
Changing this didn’t actually improve actual user experience. At some businesses this would cause meetings and delays.
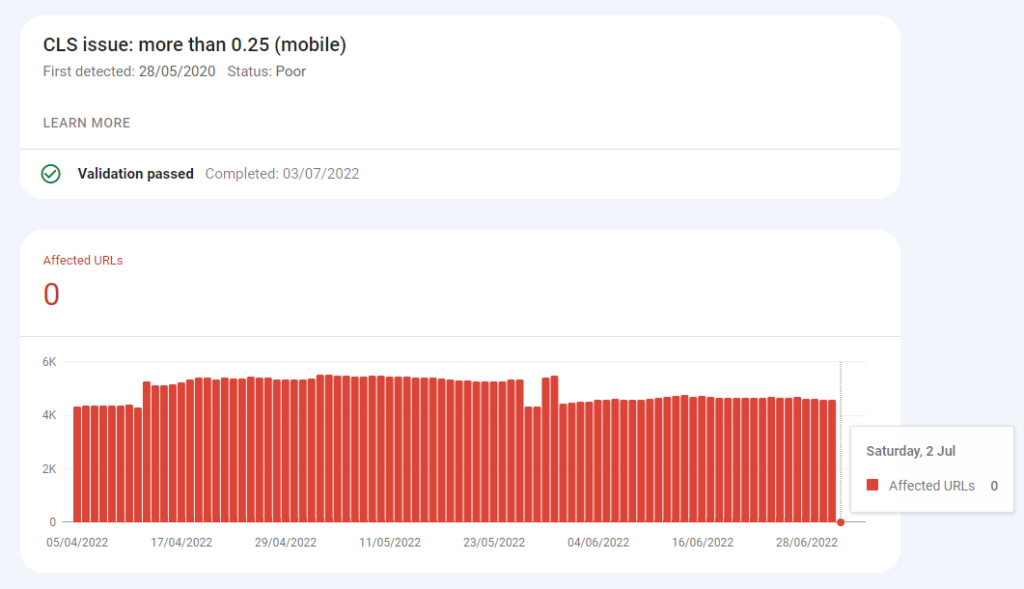
Things are better now (I think):
:~:text=
What’s also interesting is the idea that the featured snippets :~:text= link might also contribute in some scenarios. Typically I think these will fall under the has recent input change exception, so probably shouldn’t be possible, but I’m on the fence.
The data-nosnippet type fix to destroy your featured snippets probably isn’t appealing or worth it, though. You can only make these unpalatable decisions once you’ve identified potential causes.
Summary
- Cumulative Layout Shift is a session based metric. “Full Visit”. When you’ve got synthetic tests returning 0, but other sources complaining, you may still have work to do testing possible user journeys.
- External Links to your site (e.g. from Google results) can be an unexpected and delightful source of these problems. The problems are still ultimately self inflicted.
- You cannot currently get URL level CRUX data from the API filtered to Country level.
- The CRUX API feels quite heavy handed regarding normalisation. This is fine, it’s just good to know that URL ?params and #s might not return data, even if they are the real cause of your issues.
- You can and should track Real User Metrics to get more immediate feedback. This wouldn’t have helped us find the issue, but it would have let us know which fixes had impact sooner.
What might be nice
- I would like the data in Search Console and the data returned in the CRUX API to match.
- I would like the data in PageSpeed Insights and the data returned in the CRUX API to match.
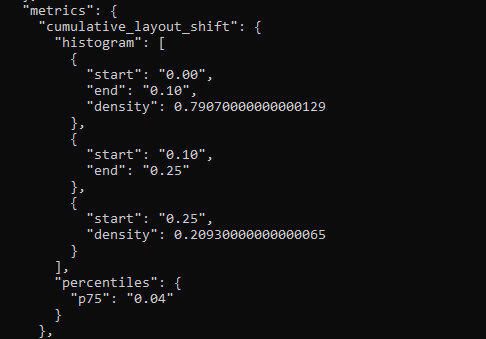
- Failing this, I would appreciate if the placebo button in Google Search Console made use of currently available CRUX API data once pressed, rather than waiting 2+ weeks, because we can query the API before pressing the button to check it’s not a waste of time:
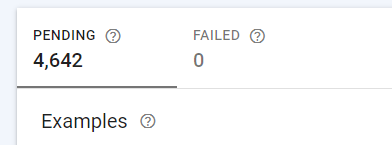
We both know it’s fixed, I’d just like the graph updated so I can forget about it.
End.
I’m experimenting a little more with posts which don’t explore novel concepts in SEO because:
- I am tired.
- I am out of good ideas I am willing to share.
- I am tired.
I am sure you are able to relate.
As always, social engagement via Twitter is appreciated.
Thanks to anyone I bothered with this along the way. Extra special thanks to Harry Theo for their assistance, suggestions, and agreeing that it did seem pretty weird.



If CLS is session based, and user logs in to the website panel, then subpages available after logging in only are also included in crux data?
Will it also count for the admin panel? :D Crazy!